Viewing your sales numbers on dashboards
Creating, editing, setting goals for, and sharing sales and CRM dashboards, and the limits for each plan
Updated 2026.10.01
This page covers seeing your sales numbers, such as won revenue and meeting counts, all in one place from Dashboards in the left navigation.
This feature is in beta. More capabilities will be added over time.
Open dashboards
Open Dashboards under Actions in the left navigation. Switch between dashboards with the tabs at the top of the screen.
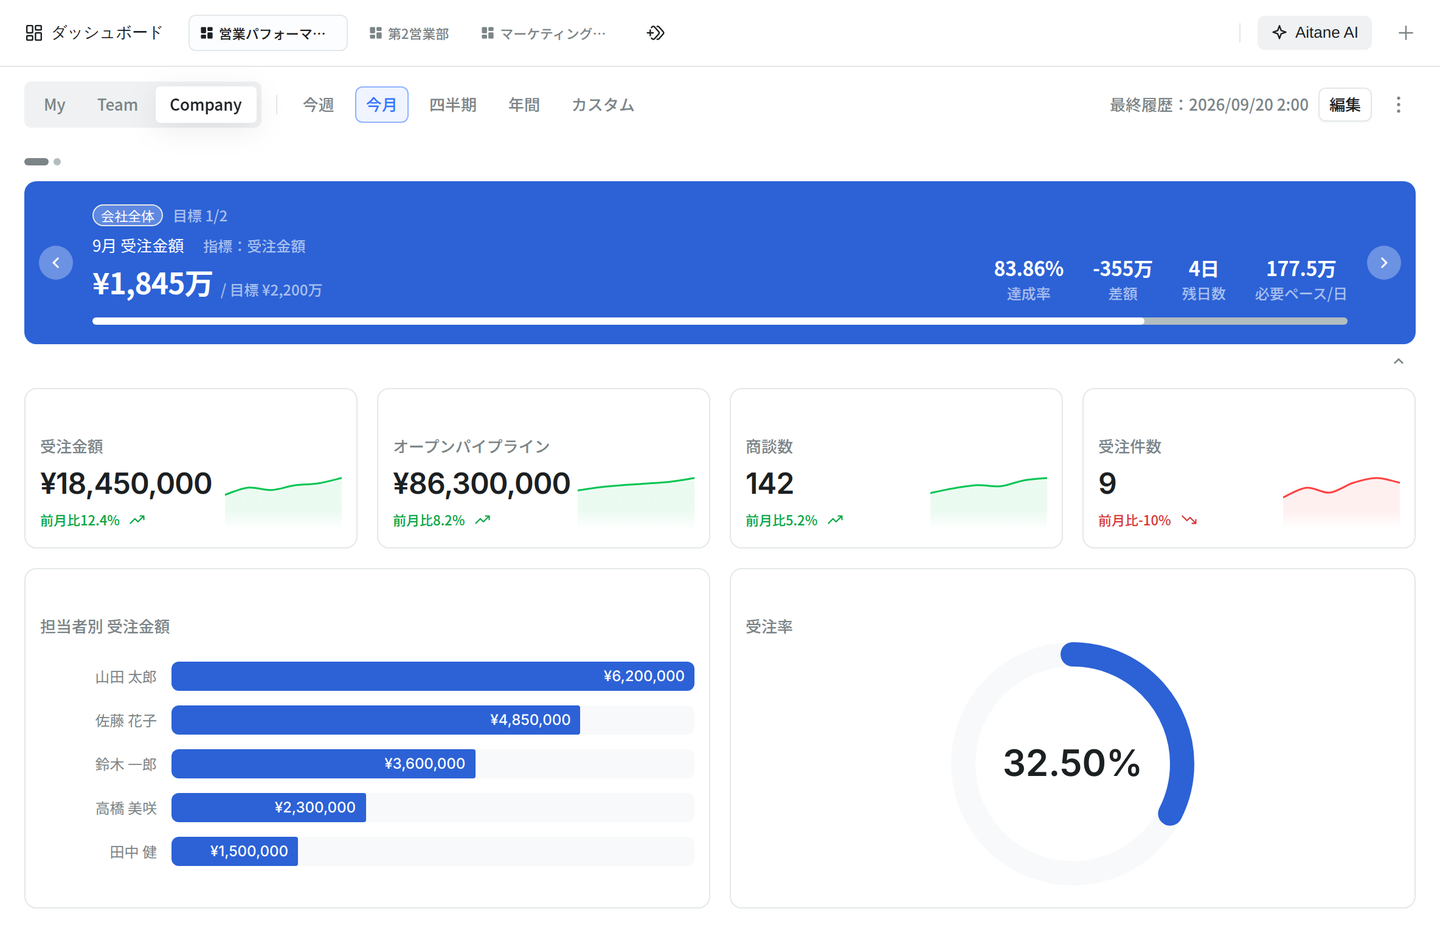
Every workspace comes with a dashboard called 営業パフォーマンス (Sales performance) from the start. At the bottom, Sales performance ranking compares results per owner.
Switch the scope and period
The switches at the top of the screen change the numbers in the widgets at once (see the exceptions below).
| Switch | Options |
|---|---|
| Scope | My (you) / Team (your team) / Company (the whole company) |
| Period | This week / This month / Quarter / Year / Custom (pick dates) |
- It starts on My and This month. The scope and period you pick aren't saved and only affect your own screen
- If you don't belong to a team, you can't choose Team
- Year uses the fiscal year. Admins set the fiscal year's start month in Settings → Workspace under Fiscal year start month (April by default)
- 受注率 (Win rate) always covers the last 90 days, whatever period you choose
- The Sales performance ranking always covers the whole company, whatever scope you choose (the period you choose still applies)
Create a dashboard
- Click + next to the tabs.
- Choose how to start.
- KPI dashboard — start with ready-made widgets and layout
- Start from blank — add the widgets you need yourself
- Type what you want into the box and send it — the AI picks the metrics and formats and builds the dashboard (see "Create and edit with AI" below)
- It opens in edit mode. Set it up and click Save.
Clicking Cancel on a dashboard you've just created deletes the dashboard itself. Click Save if you want to keep it.
To rename a dashboard, double-click its tab, or use Rename in the tab's right-click menu.
Add and edit widgets
- Click Edit.
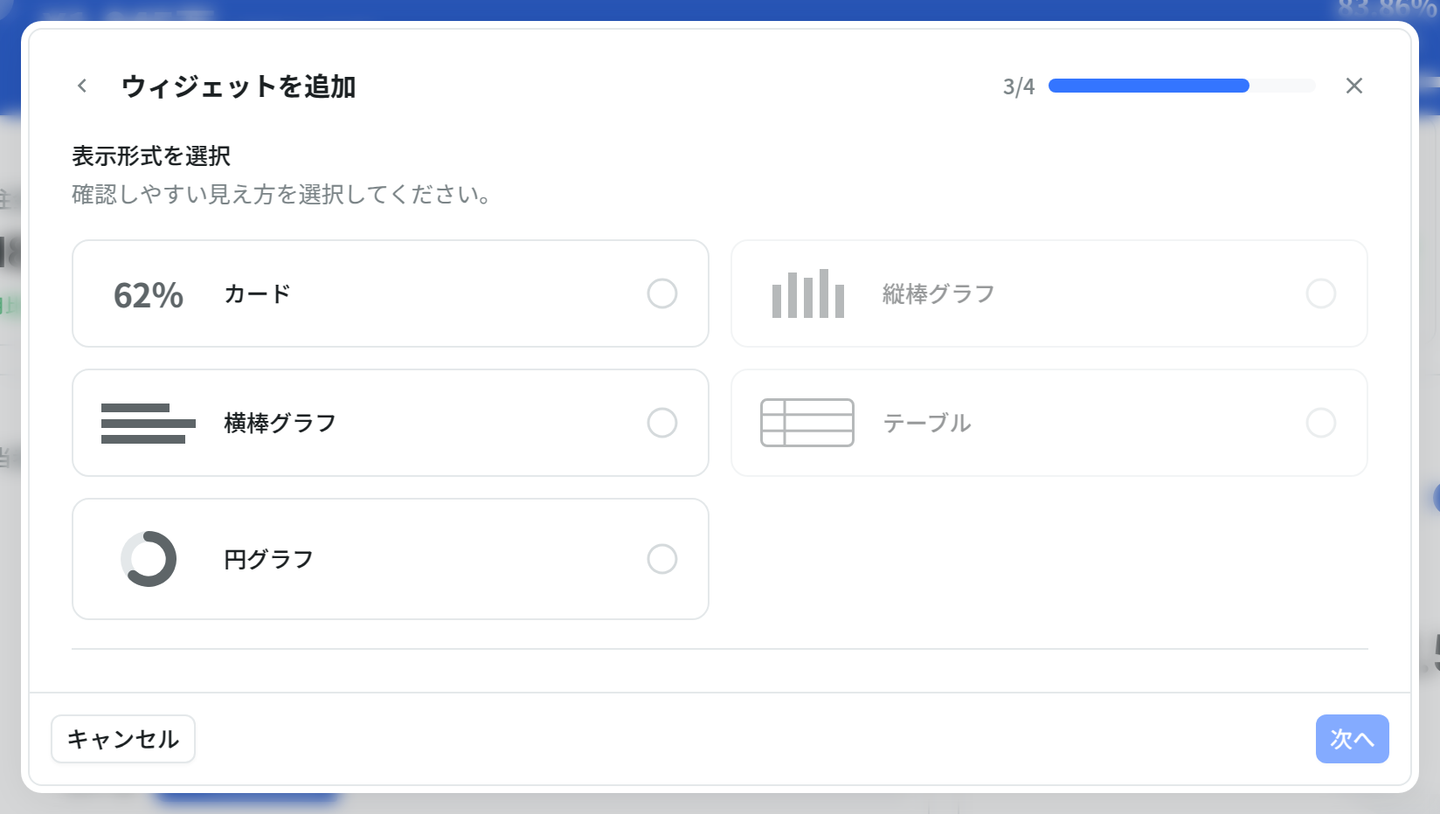
- Click Add widget, then choose Create from a metric or Create from an existing goal.
- Choose the metric and the format (Card / Vertical bar / Horizontal bar / Table / Donut), check the details, and add it.
- Click Save to apply your changes.
- Each metric has a fixed set of formats. Formats you can't use are disabled
- Drag widgets to rearrange them, and use the bottom-right handle to resize them
- From a widget's … menu you can Change data source (change the metric shown) or Delete it. To change the format, delete the widget and add it again. Widgets created from an existing goal can only be deleted
- A dashboard can hold up to 12 widgets
Available metrics
| Group | Metrics |
|---|---|
| 売上・パイプライン (Revenue and pipeline) | 受注金額 (Won revenue) / 受注件数 (Won deals) / 受注日数 (Days to win) / パイプライン (Pipeline) / 受注率 (Win rate) / 加重パイプライン (Weighted pipeline) / 予測売上 (Forecast revenue) |
| 活動量 (Activity) | 商談数 (Meetings) / 議事録率 (Minutes rate) / 送信数 (Messages sent) / 未送フォロー (Unsent follow-ups) |
| データ品質 (Data quality) | 紐付率 (Link rate) / 鮮度日数 (Data freshness in days) / 必須欠損 (Missing required fields) / 滞留案件 (Stalled deals) / 名刺スキャン (Business card scans) / 名刺登録率 (Business card registration rate) |
| 目標 (Goals) | 当日フォロー率 (Same-day follow-up rate) |
| プロセス効率 (Process efficiency) | 商談効率 (Meeting efficiency) / 会議化率 (Meeting conversion rate) |
Create and edit with AI
Describe what you want in plain language to create and edit dashboards.
- Create — on the screen for creating a dashboard, type something like "Show this month's revenue won and meeting count, and revenue won by owner" into the box ("Describe the dashboard you want to create…") and send it
- Edit — on a dashboard you can edit, click the round Aitane logo button (Ask Aitane to edit) at the bottom right and ask it to add, change, or remove widgets
Changes made by the AI aren't applied until you save. Review them and click Save.
- Widgets created or changed by the AI are marked AI generated
- Only the metrics listed under "Available metrics" above can be used
- This chat only creates and edits dashboards. It can't analyze data or answer questions, set a widget's size or position, or set goals
Set goals
When you set a goal for a metric such as won revenue, the banner at the top of the dashboard shows the Achievement rate, Difference, Days remaining, and Required pace (per day). If there are several goals, you can switch between them in the banner.
- Click Edit, then click Add goal in the banner.
- Choose a metric and enter the Target scope (Personal / Team / Whole company), Target value, and Period.
- Add it, then Save the dashboard.
- Only workspace admins can add, change, or delete goals
- The period can't be changed after the goal is created. To use a different period, create the goal again
Share
Open Share from the ︙ menu at the top right of the dashboard.
- General access — choose from Restricted (invited members only) / Team / Everyone in the workspace
- You can invite members individually and choose Can edit or Can view
- Copy link copies the dashboard's link. If a member without access opens it, that dashboard isn't shown and the dashboard in the first tab opens instead. If someone who isn't in the workspace opens it, they're taken to the Meetings screen
A newly created dashboard is visible only to the person who created it. Only the creator (owner) can change the sharing settings.
Duplicate or delete
Right-click a tab to choose Rename / Duplicate / Delete dashboard.
- A duplicate is named "(original name) のコピー" (copy), and the person who duplicated it becomes the owner
- Only the owner can delete a dashboard
- 営業パフォーマンス (Sales performance) can't be deleted or shared. It's always visible to everyone in the workspace. Workspace admins can edit it
Not supported
- Scheduled report delivery (email, Slack, and so on)
- Export to PDF or CSV
- Filters on individual widgets
Plan differences
| Plan | What you can do |
|---|---|
| Free | View shared dashboards and 営業パフォーマンス (Sales performance). You can't create or edit dashboards or set goals |
| Standard | Create and edit dashboards. Up to 2 dashboards you created per person |
| Business / Enterprise | Create and edit dashboards, with no limit |